Tolerance of Inter-Ethnic Relationships in Europe
Analyses cross-country variation in tolerance of inter-ethnic relationships in Europe, using data from a 2015 Special EB survey
I had seen this interesting map, apparently created by the Reddit user bezzleford, posted a number of times. So I decided to track down the original data. It turns out they are from a 2015 Special EB survey titled ‘Discrimination in the EU in 2015’.
The survey asked various questions about tolerance and discrimination to citizens of all 28 EU member states. A particularly interesting series of questions in the survey concerns tolerance of inter-ethnic relationships. Specifically, respondents were asked:
Regardless of whether you have children or not, please tell me, using a scale from 1 to 10, how comfortable you would feel if one of your children was in a love relationship with a person from each of the following groups. ‘1’ means that you would feel, “not at all comfortable” and ‘10’ that you would feel “totally comfortable”.
They were asked this question with reference to twelve different groups, including ethnic groups, sexual minorities, and disabled people. I obtained the country-level means corresponding to six ethnic minority groups: ‘a Roma person’, ‘a black person’, ‘an Asian person’, ‘a Jewish person’, ‘a Muslim person’, and ‘a Buddhist person’.
Across 28 EU countries, mean tolerance of child’s inter-ethnic relationships was lowest for ‘a Roma person’ (5.2) and was highest for ‘a Jewish person’ (7.1). Looking at the six-by-six correlation matrix, all the values were large (and significant at p < 0.001). They ranged from r = .85 for the relationship between tolerance of ‘a Roma person’ and tolerance of ‘a Jewish person’, to r = .98 for the relationship between tolerance of ‘a black person’ and tolerance of ‘an Asian person’.
The chart below shows the relationship between tolerance of ‘a black person’ and tolerance of ‘an Asian person’. On average, Europeans were slightly less tolerant of their child’s relationship with a black person than of their child’s relationship with an Asian person.

The next chart shows the relationship between tolerance of ‘a Muslim person’ and tolerance of ‘a Jewish person’. On average, Europeans were considerably less tolerant of their child’s relationship with a Muslim person than of their child’s relationship with a Jewish person.

In both charts, there is a strong positive relationship between the two variables (as we already knew from the correlation matrix): countries that are more tolerant of one ethnic minority group tend to be more tolerant of other ethnic minority groups. One possibility is that this arises purely due to the compositional effect from having more ethnic minorities in certain countries. For example, perhaps countries like the UK and France are more tolerant of ‘a Jewish person’ simply because there are more Jewish people in these countries, and all Jewish survey respondents say they are tolerant of their own group.
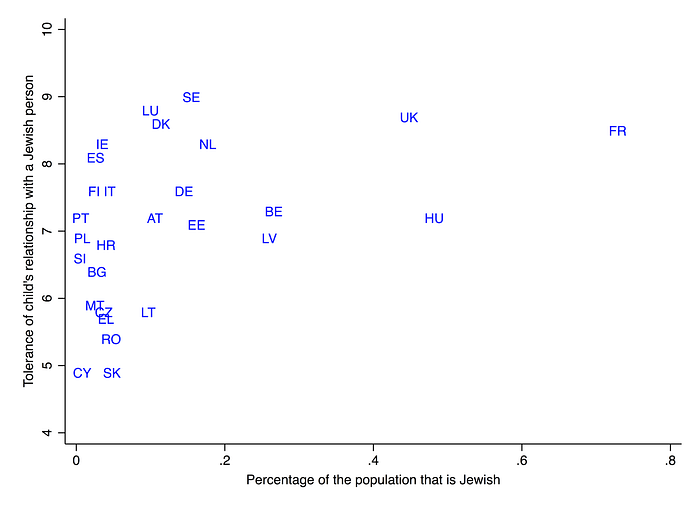
Although such compositional effects surely do exist, they will not be large enough to explain the sizeable cross-country differences in tolerance. For example, even if every Jewish survey respondent in France answered ‘10’, the effect would be nowhere near large enough to explain the difference in tolerance between France and, say, Slovakia, given that Jews only comprise 0.7% of the French population. By way of illustration, the chart below shows the relationship between tolerance of ‘a Jewish person’ and percentage of the population that is Jewish in 2015, taken from the World Jewish Population.
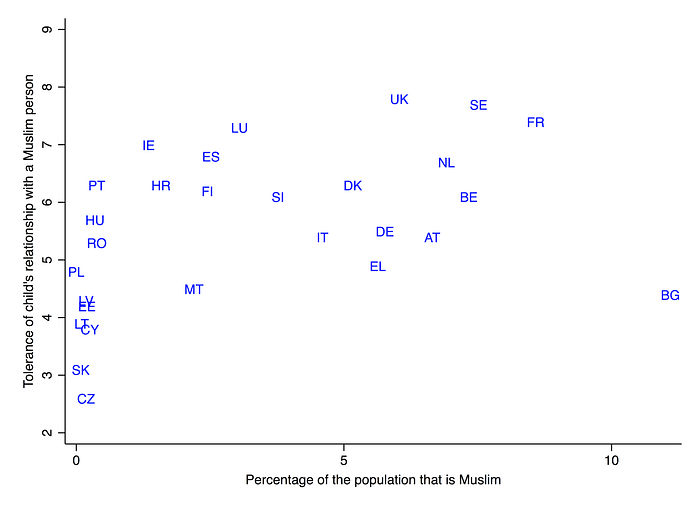
The compositional effects will be larger for Muslims and Asians, but still quite small overall. The chart below shows the relationship between tolerance of ‘a Muslim person’ and percentage of the population that is Muslim in 2015, taken from the Pew Research Centre. (Percentage Muslim in 2015 was calculated as the weighted average of the 2010 and 2016 values.)
In light of the preceding results, I ran a PCA on the six measures of tolerance. Unsurprisingly, the first principal component explained almost all the variance (93%), while the second principal component explained only 3% of the variance. Hence I computed a simple average tolerance across the six measures, separately for each country. Figures are show in the chart below.
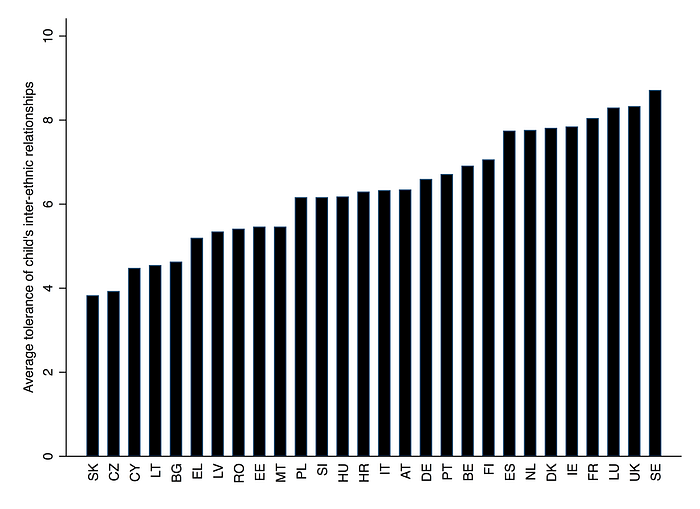
The three most tolerant countries are Sweden (8.7), the UK (8.3) and Luxembourg (8.3), while the three least tolerant countries are Slovakia (3.8), Czechia (3.9) and Cyprus (4.5). I would add once again that these differences cannot be easily explained by compositional effect from having more ethnic minorities in certain countries. First, ethnic minorities do not comprise a large enough share of the relevant countries’ populations to substantially alter their averages. Second, the survey probably under-sampled ethnic minorities. Third, a large share of respondents in the most tolerant countries already give the maximum answer (e.g., 54% of British respondents answered ‘10’ to the question referring to ‘a Muslim person’). Fourth, some ethnic minorities are probably less tolerant of out-groups than the general population.
Another possibility is that the general factor of tolerance arises due to the tendency for respondents in more socially conservative countries to be more concerned about their child’s relationship with anyone (regardless of his or her ethnic background). To check this, I looked at the relationship between average tolerance of child’s inter-ethnic relationships and tolerance of child’s relationship with a white person (which the survey also asked about). As shown in the chart below, there was very little cross-country variation in the latter variable: the figures ranged from 8.8 (Slovakia) to 9.8 (Sweden).
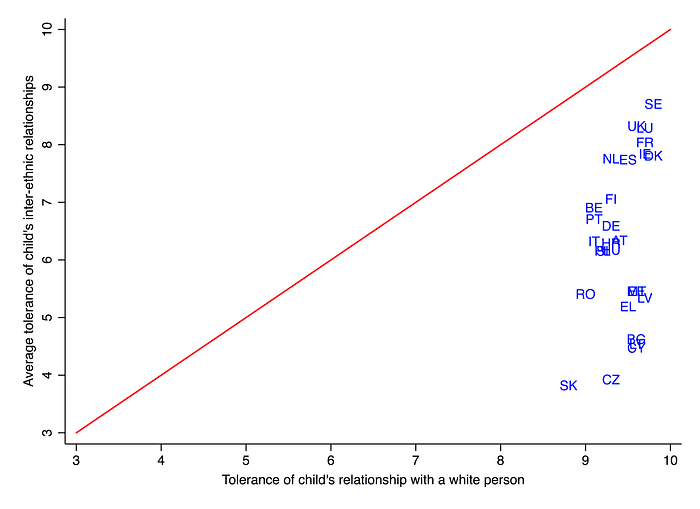
Interestingly however, there was a slight tendency for countries with higher average tolerance to be more tolerant of their child’s relationship with ‘a white person’, suggesting a possible effect of general social conservatism (r = .35, p = 0.066). I therefore regressed average tolerance on tolerance of a ‘white person’, saved the residuals, and then added these to the overall average tolerance. Figures are shown in the chart below.
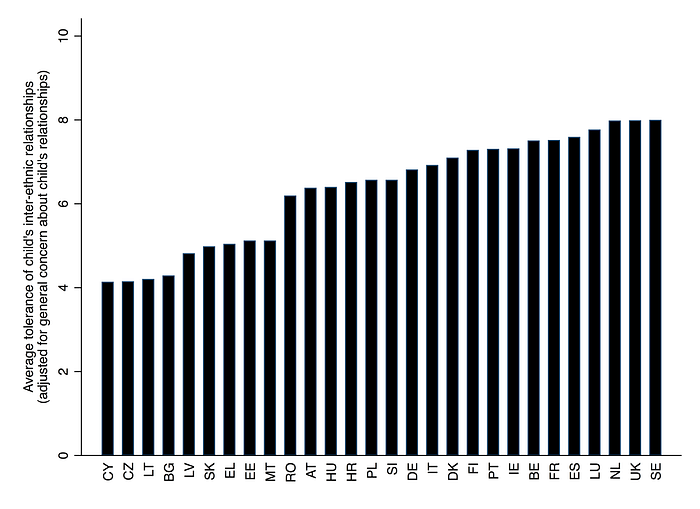
The rank order is approximately the same as before, although with a few changes (adjusted tolerance was correlated with unadjusted tolerance at r = .94). The three most tolerant countries are now Sweden (8.0), the UK (8.0) and the Netherlands (8.0), and the three least tolerant countries are now Cyprus (4.1), Czechia (4.2) and Lithuania (4.2). Another possibility, which cannot be ruled out with the available data, is that social desirability bias varies substantially across countries.